
What Is A Graph Database?
Graph databases are databases designed to cope with highly interconnected data. The more connected the data, the better they perform. In a Graph database, the connections and relationships between data are just as important as the data itself. They could be described as more ‘relational’ than the so-called relational databases.
What are graph databases made of?
Whilst different terminologies are used for the components that exist within a graph database model, they are commonly referred to as nodes and links.
Nodes
A node can be thought of as a “container for information” within which data properties can be stored.
Node permutations are limitless and can be designed and customised to represent and contain specific requirements.
Links
Links indicate relationships between nodes. Every link has a start point, end point and a property attached to the link.
Properties (in the form of text labels) and styles (colours, weights, solid/dashed) can also be added to links, enabling easier interpretation.
Graph vs Relational databases
It is worth noting that relational databases can be an adequate solution for containing data that will not be changed regularly. However, this rigidity can introduce challenges when making changes to a database. For example, if new data points are added to the database or if existing entries are edited.
One of the many advantages of a graph database vs an SQL database is the response speed with depth of queries. An SQL database can perform well with a rigid design but can grind to a halt if the schema gets too complex or if changes are made to the database.
Using a social network as an example, benchmark tests were carried out by finding all the friends of a user’s friends and further friends, etc. The query was created in both SQL and Graph with a database of 1,000,000 entities.
|
Query Depth |
SQL database execution time | Graph database execution time |
|
2 |
0.016 |
0.01 |
|
3 |
30.3 |
0.17 |
|
4 |
1,543.5 |
1.36 |
| 5 | Not finished in 1 hour |
2.13 |
Note; execution time is in seconds, for 1,000 users.
In this simple “friends of friends” query, graph was 40% faster than SQL. For the friends of friends of friends (query depth 3), graph was 180 times faster. For the depth four query, graph was 1,135 times faster than SQL.
SQL could not process a depth 5 query within one hour. When compared to graph, which completed this test in 2.13 seconds, the differences in performance speeds are significant.
This experiment has been carried out and benchmarked by numerous test labs and software houses with similar results.
|
Query Depth |
Graph vs SQL performance |
|
2 |
40% faster |
|
3 |
180x faster |
|
4 |
1,135x faster |
|
5 |
N/A |
Graph database examples
Whilst graph databases can be beneficial for any business type or size, there numerous examples of businesses that have gained additional benefits from adopting a graph database model.
Social Networks
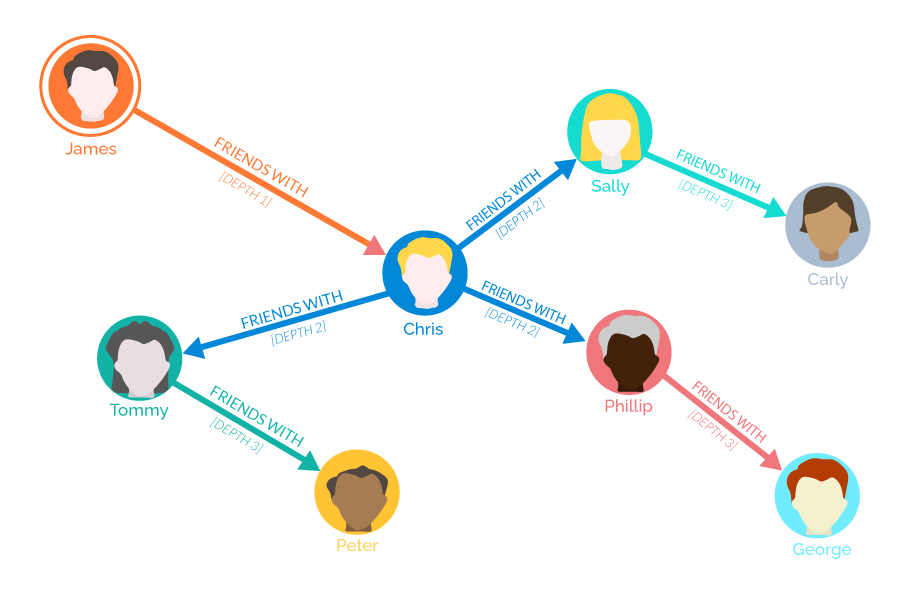
Graph databases can provide a powerful solution for identifying connections between nodes. In the case of a social media platform, the platform’s users would be represented by nodes which would store various forms of personal information including date of birth, name, location, education etc.
The links between the user nodes would indicate friends or followers at the first depth level and/or friends of friends at a secondary depth level. Harnessing a graph database for this data set could enable the social media platform users to be shown suggested friends or followers to add to their network (see example below).
How can Kradle Data Visualizer help my business?
Many database offerings on the market (both graph and relational) require users to learn a dedicated query language to navigate their data model and retrieve the desired information.
This requirement to learn a query language can often prevent small to medium-sized businesses from adopting a graph database due to resource limitations or skill shortages.
With Kradle Data Visualizer, no programming knowledge is required. Users can easily add, edit and remove nodes, links and their attached properties using an intuitive drag and drop interface. Once the data model has been created, users can search or apply filters to their data model to identify relationships within the accrued data.
Conclusion
Deciding whether to choose a relational or graph database will take careful consideration of your specific requirements and current data set. Whilst relational databases can be a good fit for some businesses, the benefits of adopting a graph database can be far-reaching, including significantly faster query processing times, flexibility when editing and a more ‘visual’ representation of data.
Kradle offers a no-code graph database modelling tool that allows for fast design, navigation and data visualization. With Kradle you can easily build a model to represent your data enabling the discovery of previously unseen relationships between nodes that may previously have been difficult to see within a relational database.
To learn more about what Kradle Data Visualizer can do for your business, please visit www.kradle.com/data-visualizer or contact us.